Looker Studio Dashboard Development | Adslytics | Adslytics


Looker Studio Dashboard Development

Looker Studio Dashboard Development

Custom Looker Studio dashboards that turn your GA4, Google Ads, and ecommerce data into clear, actionable reports your whole team can understand.

GA4 Dashboard Google Ads Dashboard Ecommerce Dashboard SEO Dashboard Executive KPI Dashboard Custom Report Development Multi-Source Data Blending Automated Daily Refresh Interactive Filters & Controls Scheduled Email Delivery
Top Rated Plus Agency 98% Job Success 232+ Projects $100K+ Earned

Looker Studio Dashboard Development

Beautiful, accurate, automated dashboards that replace manual reporting and give every stakeholder instant visibility into the metrics that matter.

GA4 Dashboard
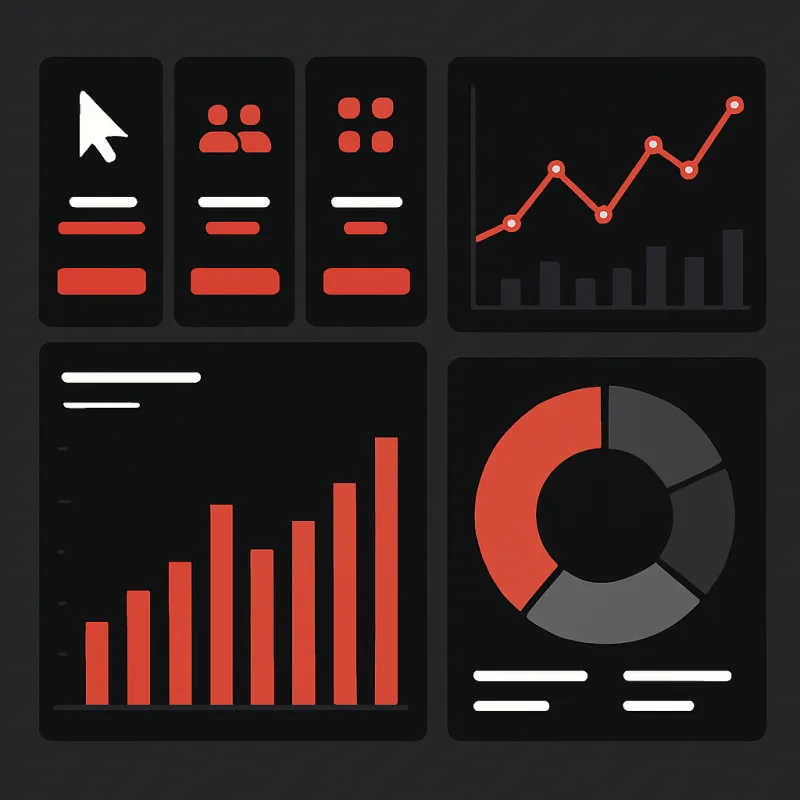
We build a multi-page GA4 Looker Studio dashboard covering traffic acquisition by channel and source/medium, landing page performance, user engagement metrics, conversion funnel, goal completion trends, audience demographics, and device/browser breakdown. Includes interactive date range controls, segment filters, and year-over-year comparison capability for all key metrics.
GA4 Dashboard

Google Ads Dashboard

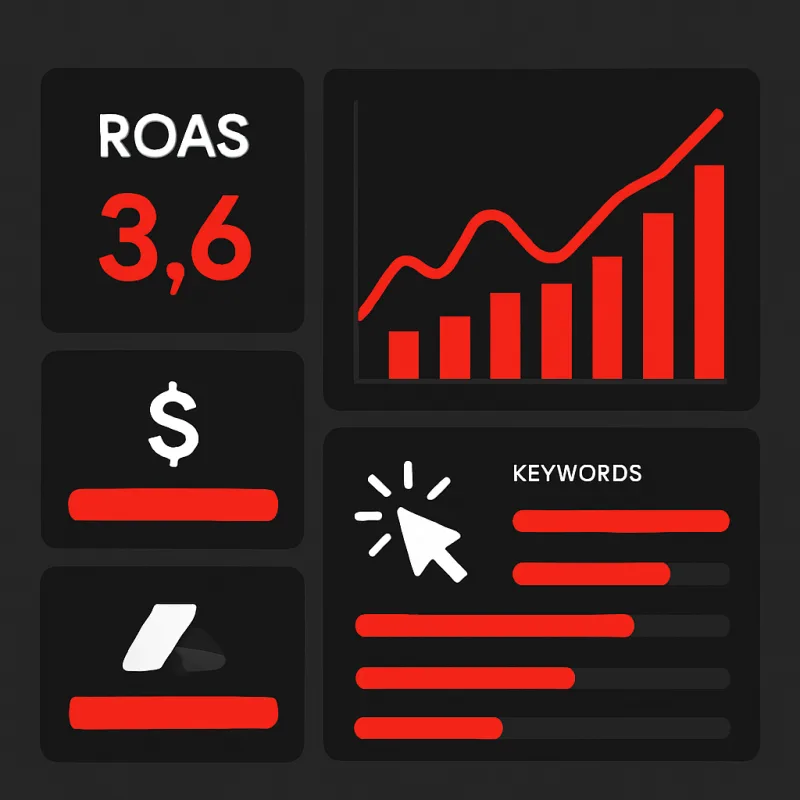
We build a Google Ads Looker Studio dashboard covering campaign and ad group performance (impressions, clicks, CTR, CPC, conversions, CPA, ROAS), keyword performance with quality score, search impression share, auction insights, budget pacing charts, and conversion trend over time. Connects directly to your Google Ads account with daily automatic data refresh.
Google Ads Dashboard

Ecommerce Dashboard
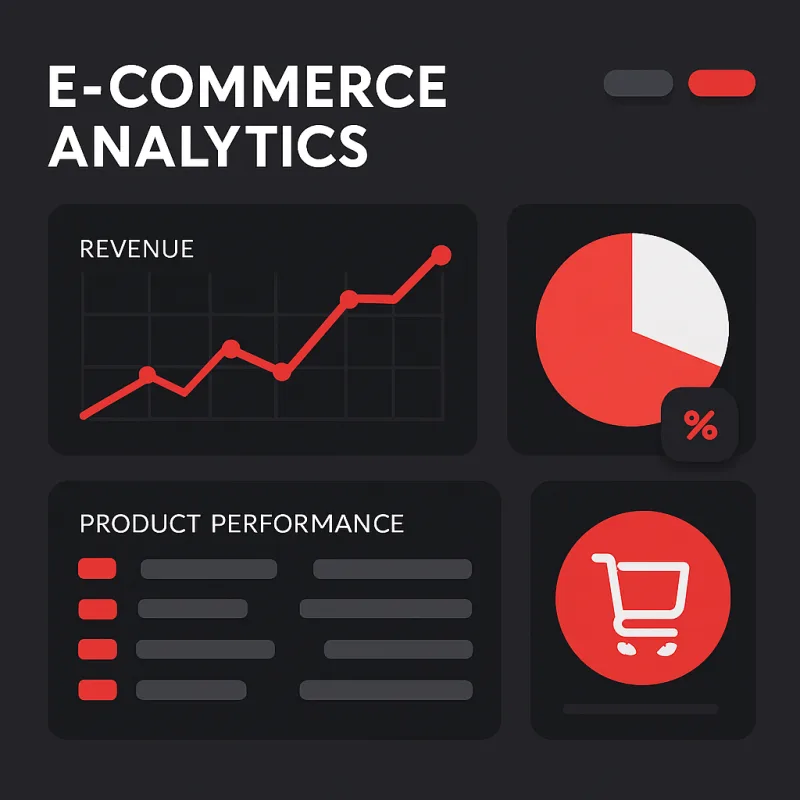
We build a GA4 ecommerce Looker Studio dashboard covering revenue trend, transaction count, conversion rate, average order value, top products by revenue and units, checkout funnel drop-off analysis, cart abandonment rate, revenue by traffic channel, and customer acquisition cost versus revenue by source. Built on GA4 Enhanced Ecommerce data with correct deduplication.
Ecommerce Dashboard

SEO Dashboard

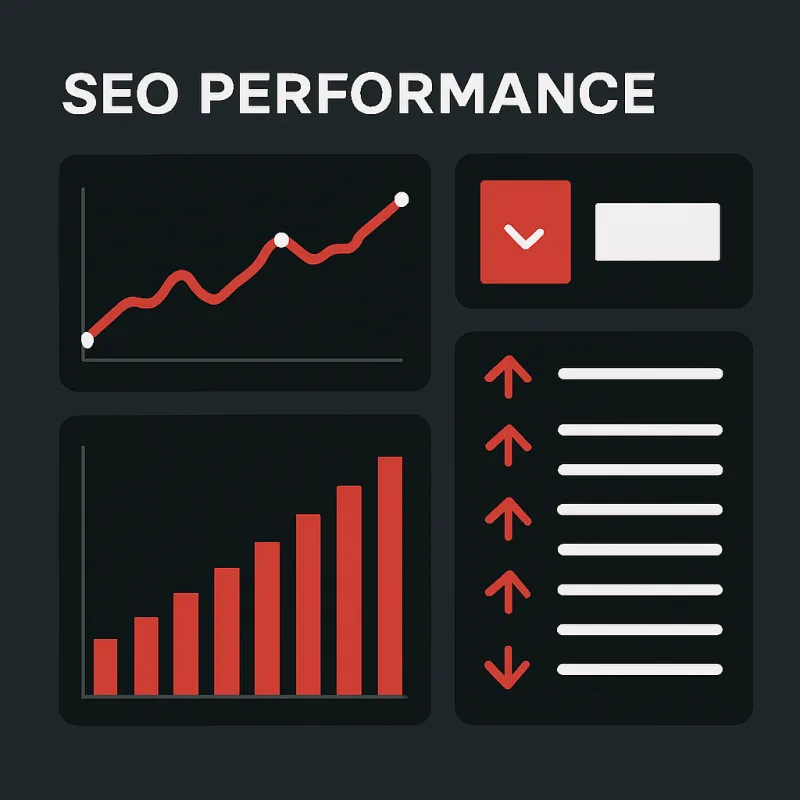
We blend Google Search Console and GA4 data in a Looker Studio SEO dashboard covering impressions, clicks, CTR, and average position by query and landing page; organic session and conversion trend; page-level SEO performance; keyword opportunity analysis highlighting high-impression, low-CTR queries; and mobile versus desktop search performance side by side.
SEO Dashboard

Executive KPI Dashboard
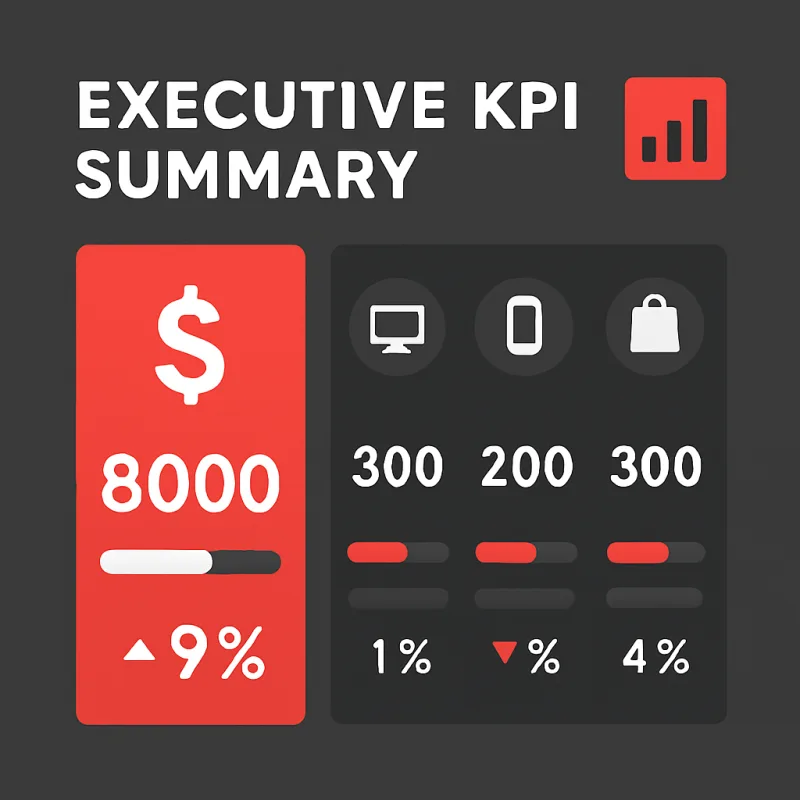
We design a concise executive dashboard consolidating marketing and business KPIs from multiple sources (GA4, Google Ads, Meta Ads, revenue data) into a single, jargon-free overview. Designed for weekly or monthly leadership review: total revenue, channel ROAS, cost per acquisition, YoY growth rates, and colour-coded trend scorecards. Includes scheduled email snapshot delivery.
Executive KPI Dashboard

Custom Report Development

For reporting requirements that do not fit standard templates — multi-brand dashboards, franchise network reporting, custom attribution models, or specific blended data source combinations — we build entirely custom Looker Studio reports to your specification. We scope data sources, define metrics and dimensions, design the page layout, and build and test the complete report with your stakeholders.
Custom Report Development

Worried About Your Budget?

STOP RIGHT NOW!

Take a look at our pricing and packages that will fit your needs and budget.

Dashboard Starter

Essential marketing dashboard for key metrics

$299

$149 /One Time
  • 1 Custom Dashboard
  • Up to 5 Data Sources
  • GA4 & Google Ads Connection
  • Standard KPI Widgets
  • Mobile-Responsive Design
  • Basic Filters & Date Range
Get Started

Dashboard Professional

Multi-page executive dashboard with custom data

$699

$299 /One Time
  • Up to 5 Custom Dashboards
  • 10+ Data Source Connections
  • BigQuery Integration
  • Custom Calculated Fields
  • Automated Email Scheduling
  • Brand-Matched Design
  • Interactive Drill-Downs
  • Priority Support
Get Started

Dashboard Enterprise

Full BI suite with custom connectors and automation

$1,199

$499 /One Time
  • Unlimited Dashboards
  • Custom Data Connectors
  • Real-Time Data Feeds
  • Multi-Team Access Control
  • White-Label Reports
  • Automated Insights Alerts
  • Executive Report Templates
  • Dedicated BI Developer
Contact Us
Manual reporting kills marketing productivity. Pulling data from GA4, Google Ads, Google Search Console, Meta Business Manager, and your ecommerce platform into a weekly PowerPoint or spreadsheet takes hours that should be spent on analysis and optimisation. Looker Studio eliminates this entirely — replacing static, manually-built reports with live, automatically-updated dashboards that anyone in your organisation can access at any time. At Adslytics, we design and build Looker Studio dashboards that do far more than display numbers. Every dashboard we build starts with a conversation about which decisions the report needs to support — because a dashboard that displays the right metrics in the right context drives better decisions than one that simply shows everything. We design each page around a clear analytical purpose: channel performance comparison, campaign ROAS analysis, checkout funnel optimisation, keyword opportunity identification, or executive KPI tracking. Our Looker Studio implementation covers every technical layer that separates professional dashboards from amateur ones. We build blended data sources that combine GA4, Google Ads, Google Search Console, and BigQuery data in a single chart — without the accuracy problems that come from blending incorrectly. We create calculated fields and custom metrics that reflect your specific business model: blended ROAS across channels, revenue per session by traffic source, conversion rate by device and landing page combination. We design date comparison controls, dimension filter dropdowns, and segment selectors that let non-technical users explore data themselves without needing to request custom reports. Performance is engineered into every dashboard. Poorly built Looker Studio reports can take 30–60 seconds to load — discouraging the regular use that makes dashboards valuable. We optimise data source connections, pre-aggregate data in BigQuery or Google Sheets where needed, and limit chart complexity to keep every page loading in under 5 seconds. The result is a reporting system your team will actually use — because it is fast, clear, and built around the questions your business genuinely needs to answer.

Got Questions?

Frequently Asked Questions

Looker Studio (formerly Google Data Studio) is Google's free business intelligence and data visualisation platform. It connects to over 800 data sources — including GA4, Google Ads, Google Search Console, BigQuery, Google Sheets, and many third-party connectors — and turns that data into interactive, shareable dashboards. The core Looker Studio product is completely free; Looker Studio Pro adds team workspaces and enterprise features for a fee.
A single-page dashboard for a single data source (e.g., a GA4 traffic overview) typically takes 2–3 days. A multi-page dashboard blending GA4, Google Ads, and ecommerce data with custom calculated fields and interactive filters typically takes 5–10 business days. Executive KPI dashboards covering multiple channels and business units can take 2–4 weeks depending on scope and data source complexity.
Looker Studio connects natively to all Google products: GA4, Google Ads, Google Search Console, YouTube Analytics, BigQuery, Google Sheets, Google Analytics (UA), Display & Video 360, Search Ads 360, and Campaign Manager 360. Third-party connectors (some free, some paid) extend coverage to Meta Ads, TikTok Ads, LinkedIn Ads, HubSpot, Salesforce, Shopify, Stripe, Ahrefs, SEMrush, and hundreds of other platforms.
Yes. Looker Studio dashboards can be shared with specific Google accounts (view or edit access), shared via a link (view-only or editable), or embedded in a website or intranet page. You can also schedule automated email delivery of dashboard snapshots to stakeholders who prefer reports pushed to them rather than logging in. We configure appropriate sharing permissions as part of every dashboard we build.
Data blending combines data from multiple sources in a single chart — for example, showing GA4 sessions alongside Google Ads spend and conversions in one table, or comparing organic sessions from Search Console with paid sessions from Google Ads on the same chart. It requires a join key (typically date) and careful configuration to avoid misleading results. We use data blending where appropriate and BigQuery-based pre-aggregation for complex multi-source scenarios where blending would create accuracy issues.
Slow Looker Studio dashboards are usually caused by: too many charts per page (each queries the data source separately), using unoptimised GA4 connections with large date ranges and many dimensions, blended data sources with complex joins, or live BigQuery connections scanning raw event tables on every load. We address all of these with page design optimisation, pre-aggregated BigQuery views, and data source caching where appropriate.
Yes. Looker Studio dashboards connected to GA4, Google Ads, and other live sources update automatically — typically with a data freshness of 12 hours for GA4 and near real-time for Google Ads. BigQuery-backed dashboards using scheduled queries update on the schedule you define. You can also set viewer-level data freshness (forcing a refresh when someone views the report) or use manual refresh triggers.
A calculated field is a custom metric or dimension you define using a formula — similar to a calculated column in a spreadsheet. Examples include: blended ROAS (revenue divided by ad spend), conversion rate (conversions divided by sessions, expressed as a percentage), average order value (revenue divided by transactions), or custom segment labels based on dimension values. We build all the calculated fields your dashboard needs as part of our development service.
Yes — standard Looker Studio dashboards connect directly to GA4, Google Ads, and other sources without any SQL knowledge required. However, for advanced use cases (cross-source attribution, custom cohort analysis, complex metric calculations), we use BigQuery as the data layer with pre-written SQL queries that power the Looker Studio charts. Your team interacts with the finished dashboard without ever needing to touch SQL.
For the vast majority of recurring marketing and analytics reports, yes. Looker Studio produces live, automatically-updated reports that eliminate the weekly manual export-and-format cycle. Stakeholders access the same dashboard for the latest data rather than waiting for the next report cycle. For one-off analysis or presentations requiring heavy narrative context, PowerPoint may still be used — but the underlying data can come from a Looker Studio export rather than manual pulling.

Trusted by Businesses Worldwide

What Our Clients Say

Real results from businesses who trust Adslytics with their analytics.

"Adslytics did a great job with our GA4 analysis and report. They were able to put complex analytics data into a very understandable document for our client. Highly recommend!"

Eric H.

Digital Agency Owner

"The team was quick with responses, very knowledgeable about issues, and helpful throughout the process. I appreciated their work habits and would hire Adslytics again."

Nick T.

Marketing Manager

"Adslytics is a very professional agency that managed our project successfully. They delivered exactly what was promised and I will definitely hire them again in the future!"

Hady M.

E-commerce Business Owner

Unlock Accurate Tracking That Drives More Revenue

Looker Studio Dashboard Development — Done Right

Stop losing money to broken tracking. Book a free consultation and we'll review your setup.

All Services

All Looker Studio Dashboard Development Services

Explore our complete range of specialised sub-services. Click any to learn more.

Ecommerce Performance Dashboard in Looker Studio Google Ads Performance Dashboard in Looker Studio Meta Ads Performance Dashboard in Looker Studio SEO and Organic Search Dashboard in Looker Studio Multi-Channel Attribution Dashboard in Looker Studio Executive KPI Dashboard in Looker Studio Agency Client Reporting Dashboard in Looker Studio Lead Generation Dashboard in Looker Studio Social Media Analytics Dashboard in Looker Studio Email Marketing Dashboard in Looker Studio Custom Looker Studio Dashboard Design BigQuery-Powered Looker Studio Dashboard Subscription Business Dashboard in Looker Studio Content Marketing Dashboard in Looker Studio Product Analytics Dashboard in Looker Studio Inventory and Supply Chain Dashboard in Looker Studio Financial Performance Dashboard in Looker Studio Dashboard Migration to Looker Studio Real-Time Monitoring Dashboard in Looker Studio KPI Scorecard Setup in Looker Studio Looker Studio Dashboard Template Library Looker Studio Training for Teams Looker Studio Dashboard Maintenance Retainer HR & Recruitment Analytics Dashboard SaaS Metrics Dashboard (MRR, Churn, LTV) Google Search Console Looker Studio Dashboard Call Centre & Support Analytics Dashboard Supply Chain & Operations Dashboard Nonprofit Impact & Fundraising Dashboard Customer Success (CS) Analytics Dashboard Programmatic Advertising Dashboard Marketing Budget Tracking Dashboard Retail Store Performance Dashboard Affiliate Marketing Analytics Dashboard Influencer Marketing Analytics Dashboard Competitor Price Monitoring Dashboard Customer Feedback Analytics Dashboard Sales Pipeline Analytics Dashboard Multi-Brand Analytics Dashboard App Store Analytics Dashboard

Talk to Us. It's Free.

Get accurate conversion tracking that powers smarter ad spend and real business growth.

Talk to Us, It's Free

We are always willing to help. Let us know what you are looking for, and we will develop a unique solution for you.

Thank You!

Your message has been sent successfully. We'll get back to you soon.

Protected by reCAPTCHA — Privacy & Terms

Business Hours

Our support Hotline is available 24 Hours

Toll Free

+1 (818) 245-8385