Three Debugging Tools, Different Purposes
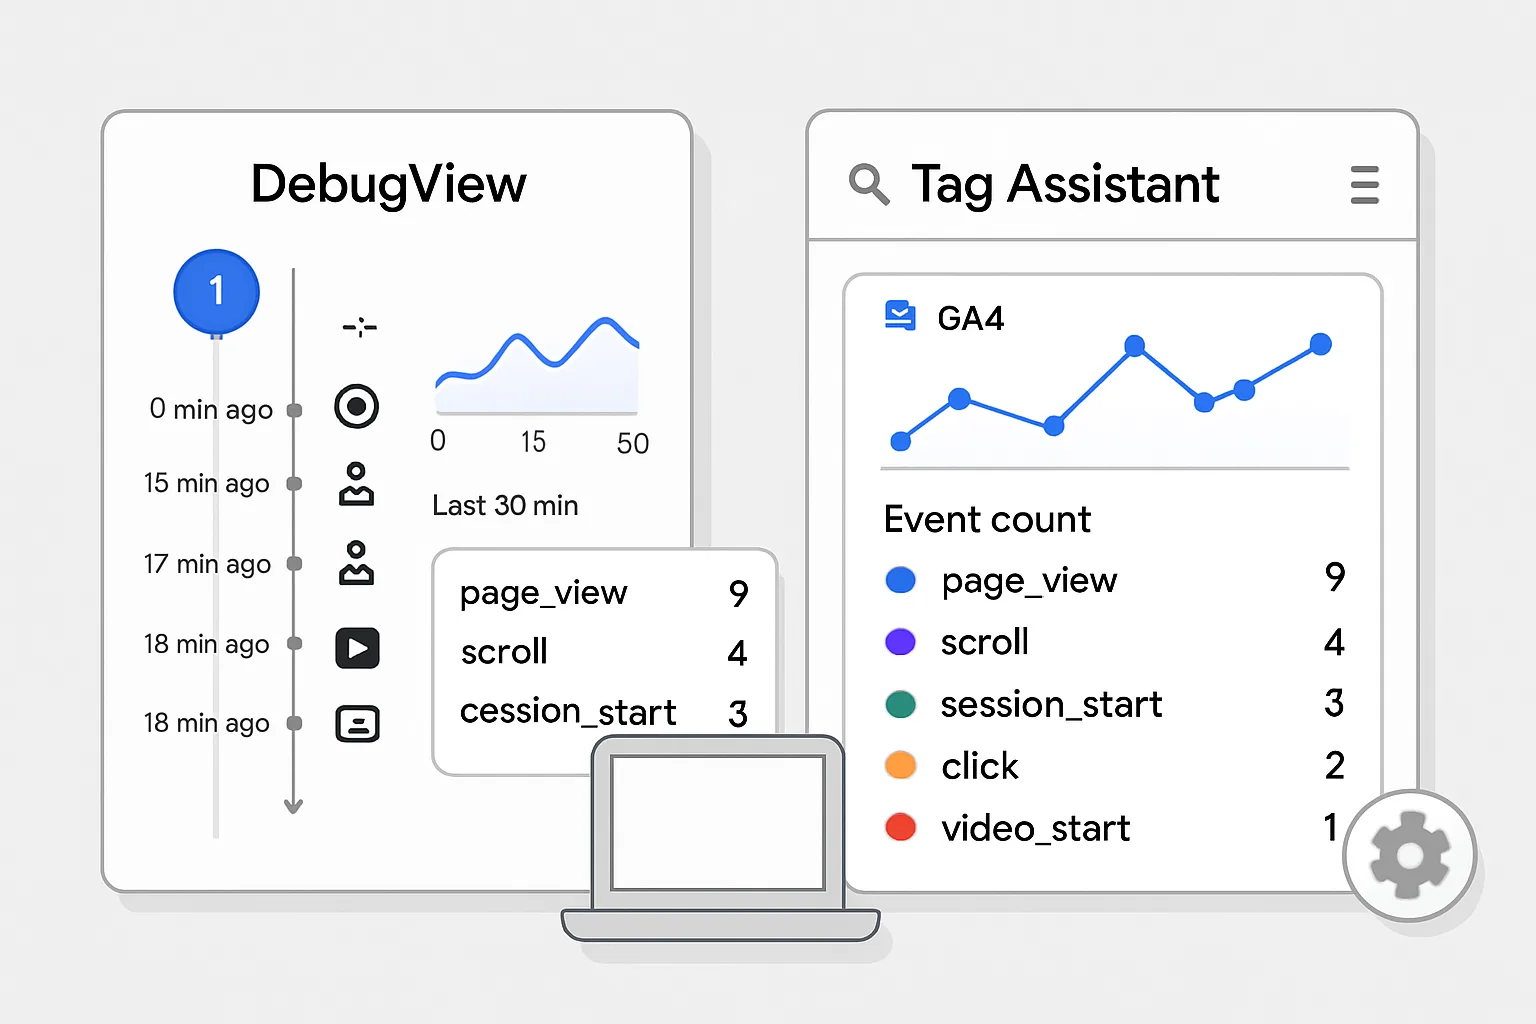
Debugging GA4 tracking issues requires different tools depending on what you are investigating. DebugView shows detailed event-level data for a specific device. Realtime shows recent events across all users. Tag Assistant diagnoses tag configuration issues at the GTM/page level.
Tool 1: GA4 DebugView
DebugView is the most granular GA4 debugging tool — it shows every event as it arrives, with all parameters, in real time, for a specific debug session.
How to Enable
- Via browser extension: install Google Tag Assistant (Chrome extension), connect to your site, and enable "Debug" mode. Your browser sends events with
debug_mode: 1parameter. - Via GTM: add a GA4 Configuration Tag parameter
debug_modewith valuetrue - Via URL: append
?gtm_debug=xto your URL and interact with GTM Preview Mode
What to Look For
- Events appear in the left timeline as you trigger them on your website
- Click any event to see all parameters in the detail panel on the right
- Check: correct event name (not a typo or capitalisation error)
- Check: all required parameters present (transaction_id, value, currency for purchase)
- Check: parameter values are correct (not undefined, not 0 for a £99 purchase)
- Check: events fire exactly once per action (not zero, not twice)
Common DebugView Findings
- purchase event with value = 0 (parameter not passed correctly)
- generate_lead fires on button click instead of form submission confirmation
- page_view fires twice on first load (duplicate tag)
Tool 2: GA4 Realtime Report
Realtime (Reports then Realtime) shows events from all users in the last 30 minutes. Use it for:
- Verifying that a recently deployed change is working across all users
- Confirming events are reaching GA4 after clearing cache on production
- Sanity-checking that session counts look roughly right for the current time of day
Realtime is less precise than DebugView for parameter inspection — it shows event counts and top events but not the full parameter detail of each event. Use DebugView for parameter-level debugging.
Tool 3: Google Tag Assistant
Tag Assistant (tagassistant.google.com) operates at the page/GTM level — it shows you which tags fire on your website, whether they fire correctly, and in what order. Use it for:
- Confirming the GA4 tag fires on all pages (not just the homepage)
- Identifying duplicate GA4 tags (two tags with different Measurement IDs, or the same ID firing twice)
- Verifying the correct GTM container is installed
- Checking for GTM Preview Mode connectivity
Tag Assistant + Connected Sites
Tag Assistant can connect to your site and record a navigation session, then show you all tag fires across multiple pages. This is useful for diagnosing issues that only occur on specific pages or after specific interactions.
Debugging Workflow
- Start with Tag Assistant: is the correct GA4 tag installed on all pages? Are there any duplicates?
- Move to DebugView: does the event fire on the correct action? Do all parameters have correct values?
- Finish with Realtime: is the event reaching GA4 in production (after any GTM publishing or code deployment)?
Summary
GA4 debugging requires three complementary tools: Tag Assistant for page/tag-level diagnosis, DebugView for event and parameter-level inspection, and Realtime for production verification. Use them in sequence — tag installation first, then event parameters, then production confirmation.
See our GA4 Setup & Audit service for tracking diagnostics.
GA4 events not tracking correctly? Contact Adslytics.
Need expert tracking setup?
Our Google Tag Manager experts have delivered 500+ tracking setups with a 98% success rate.
Get a Free Consultation →