A/B Testing Landing Page Variants for 40 Percent Conversion Lift
A/B Testing for 40 Percent Conversion Lift
📌 Introduction
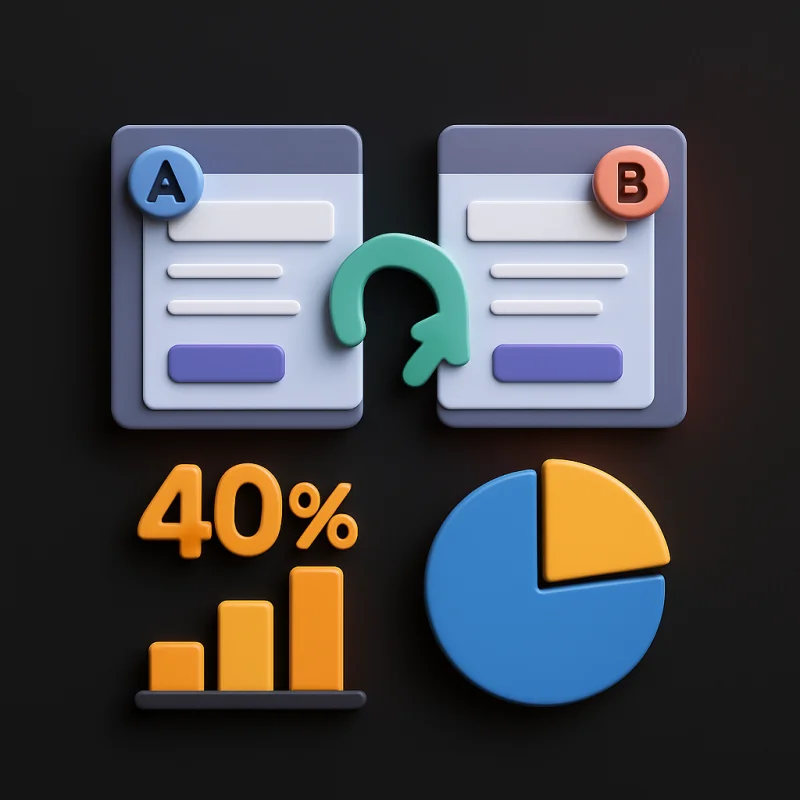
A SaaS company with significant paid search spend was achieving a 2.8% landing page conversion rate that was significantly below their 5%+ industry benchmark. A structured A/B testing program using Google Optimize aimed to systematically improve the conversion rate.
❗ The Problem
The landing page had been built by a design agency for visual appeal rather than conversion optimization. Despite strong ad click-through rates, conversion to free trial was low. The team had opinions about what to test but no framework for prioritizing tests or measuring results accurately.
🔍 Identifying the Causes
Heuristic analysis identified three high-probability conversion killers: (1) Value proposition headline was benefit-vague rather than outcome-specific, (2) Form required 7 fields (including company size and phone) before a free trial could begin, (3) Social proof (customer logos) was below the fold on mobile, invisible to 62% of mobile visitors who never scrolled.
⚠️ Consequences for the Business
At $45 CPC and 2.8% conversion, the cost per trial signup was $161. The 5% industry benchmark would represent a trial CPA of $90 — a 44% improvement in acquisition efficiency without any change to ad spend or targeting.
✅ Solution
Built a structured testing roadmap prioritizing tests by expected impact and ease of implementation. Test 1: Headline variant (vague benefit → specific outcome). Test 2: Form simplification (7 fields → 3 fields: name, email, company name). Test 3: Social proof moved above the fold for mobile. Each test ran for minimum 2 weeks with 95% statistical significance threshold.
📈 Results
Test 1 (headline): +14% conversion rate. Test 2 (form simplification): +19% conversion rate. Test 3 (social proof position): +11% conversion rate. Combined sequential improvement: landing page conversion improved from 2.8% to 4.0% — a 43% overall lift. Cost per trial signup decreased from $161 to $113 with no change to ad spend.
🏁 Conclusion
Structured A/B testing with clear hypothesis, proper statistical significance thresholds, and prioritized test sequencing delivered a 43% conversion improvement. The key is testing one element at a time with sufficient traffic to reach significance.
💡 Key Takeaways
Prioritize tests by ICE score (Impact, Confidence, Ease) to focus on high-expected-return tests first. Never declare victory before reaching 95% statistical significance — early data is unreliable. Form field reduction consistently delivers strong lift — every additional required field reduces conversion. Mobile-specific changes often deliver larger impact than desktop changes for mobile-majority traffic.
Talk to Us, It's Free
We are always willing to help. Let us know what you are looking for, and we will develop a unique solution for you.
Thank You!
Your message has been sent successfully. We'll get back to you soon.
Business Hours
Our support Hotline is available 24 Hours