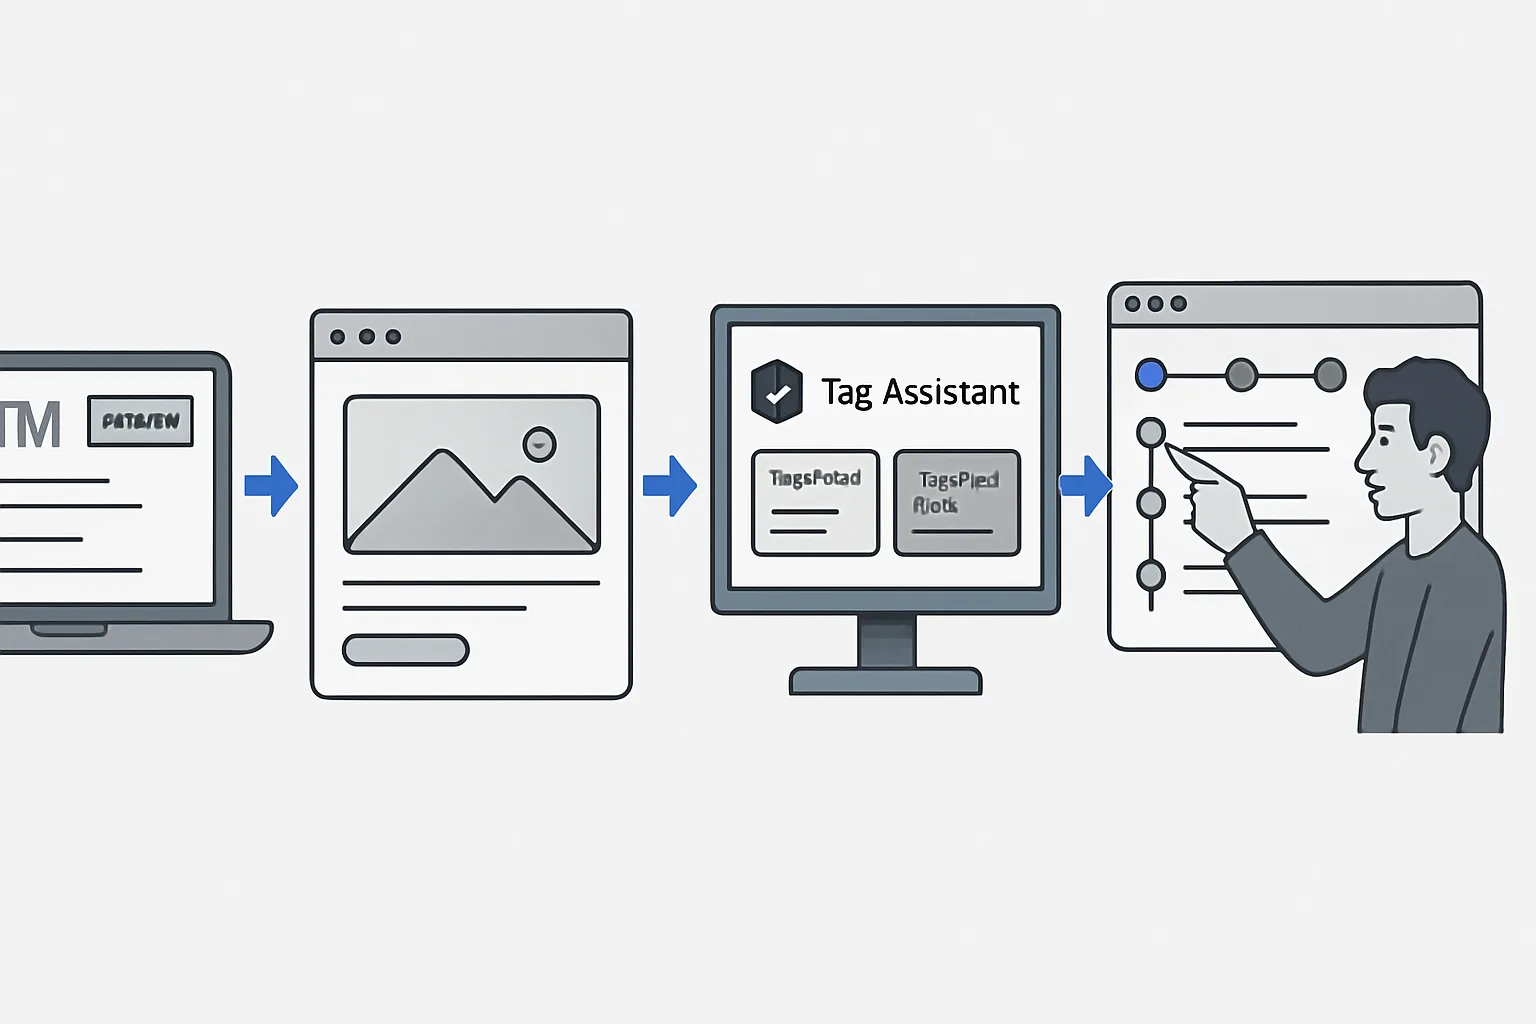
Preview Mode vs. Tag Assistant
GTM Preview Mode is the built-in debugging environment accessible from the container's toolbar. It replaced the older browser extension-based Tag Assistant. Today, clicking "Preview" in GTM opens Tag Assistant Connected, which loads your website in a special mode where all GTM events, tags, variables, and data layer states are captured and shown in a separate debugging panel.
Opening and Connecting Preview Mode
- GTM → your container → Preview (top right)
- Enter your website URL → Connect
- Your website opens in a new browser tab with GTM Preview active
- The Tag Assistant window shows events as you browse
Understanding the Timeline
The left panel shows a chronological list of events captured since the page loaded. Each entry is either:
- A page load event (e.g. DOM Ready, Window Loaded)
- A data layer push (shows the event name from the push)
- A click, form submission, or history change (if using built-in triggers)
Click any event in the timeline to see what happened at that moment.
The Three Diagnostic Tabs
Tags Tab
Shows all tags in the container, divided into "Tags Fired" and "Tags Not Fired" for the selected event.
- Tags Fired: these tags executed when the event fired
- Tags Not Fired: tags that did NOT execute — click the tag to see "Why did this tag not fire?" which shows the failing trigger condition
- Tags shown in red in "Tags Fired" fired but had a JavaScript error — click to see the error
Variables Tab
Shows all configured variables and their resolved values at the moment of the selected event. Critical for debugging data layer issues:
- If a Data Layer Variable shows "undefined" — the key name does not match what was pushed
- If a variable shows the wrong type (string "59.99" instead of number 59.99) — the data layer push sent a string
Data Layer Tab
Shows the raw data layer contents at the moment of the selected event:
- Top section: the data pushed in this specific event (delta)
- Bottom section: the cumulative data layer state (all data from all events up to this point)
Common Debugging Workflows
Tag should fire but doesn't: select the event in timeline → Tags → Tags Not Fired → click the tag → see failing trigger condition.
Tag fires with wrong value: select the firing event → Variables → find the variable → see its resolved value → compare to Data Layer tab to identify the mismatch.
Wrong event in timeline: check the Data Layer tab for the event → verify the 'event' key value matches what GTM triggers are looking for (case-sensitive).
Event not in timeline at all: open browser DevTools Console → type window.dataLayer → check if the push exists in the array but GTM did not capture it (GTM loaded after the push).
Summary
GTM Preview Mode provides three diagnostic tabs: Tags (what fired and why not), Variables (resolved values at each event), and Data Layer (raw push contents and cumulative state). Always start debugging by selecting the specific event in the timeline where the issue occurs, then check each tab systematically. The "Why did this tag not fire?" detail is the fastest path to diagnosing trigger misconfigurations.
See our Conversion Tracking Fix service for professional GTM debugging.
Need GTM issues diagnosed? Contact Adslytics.
Need expert tracking setup?
Our Google Tag Manager experts have delivered 500+ tracking setups with a 98% success rate.
Get a Free Consultation →