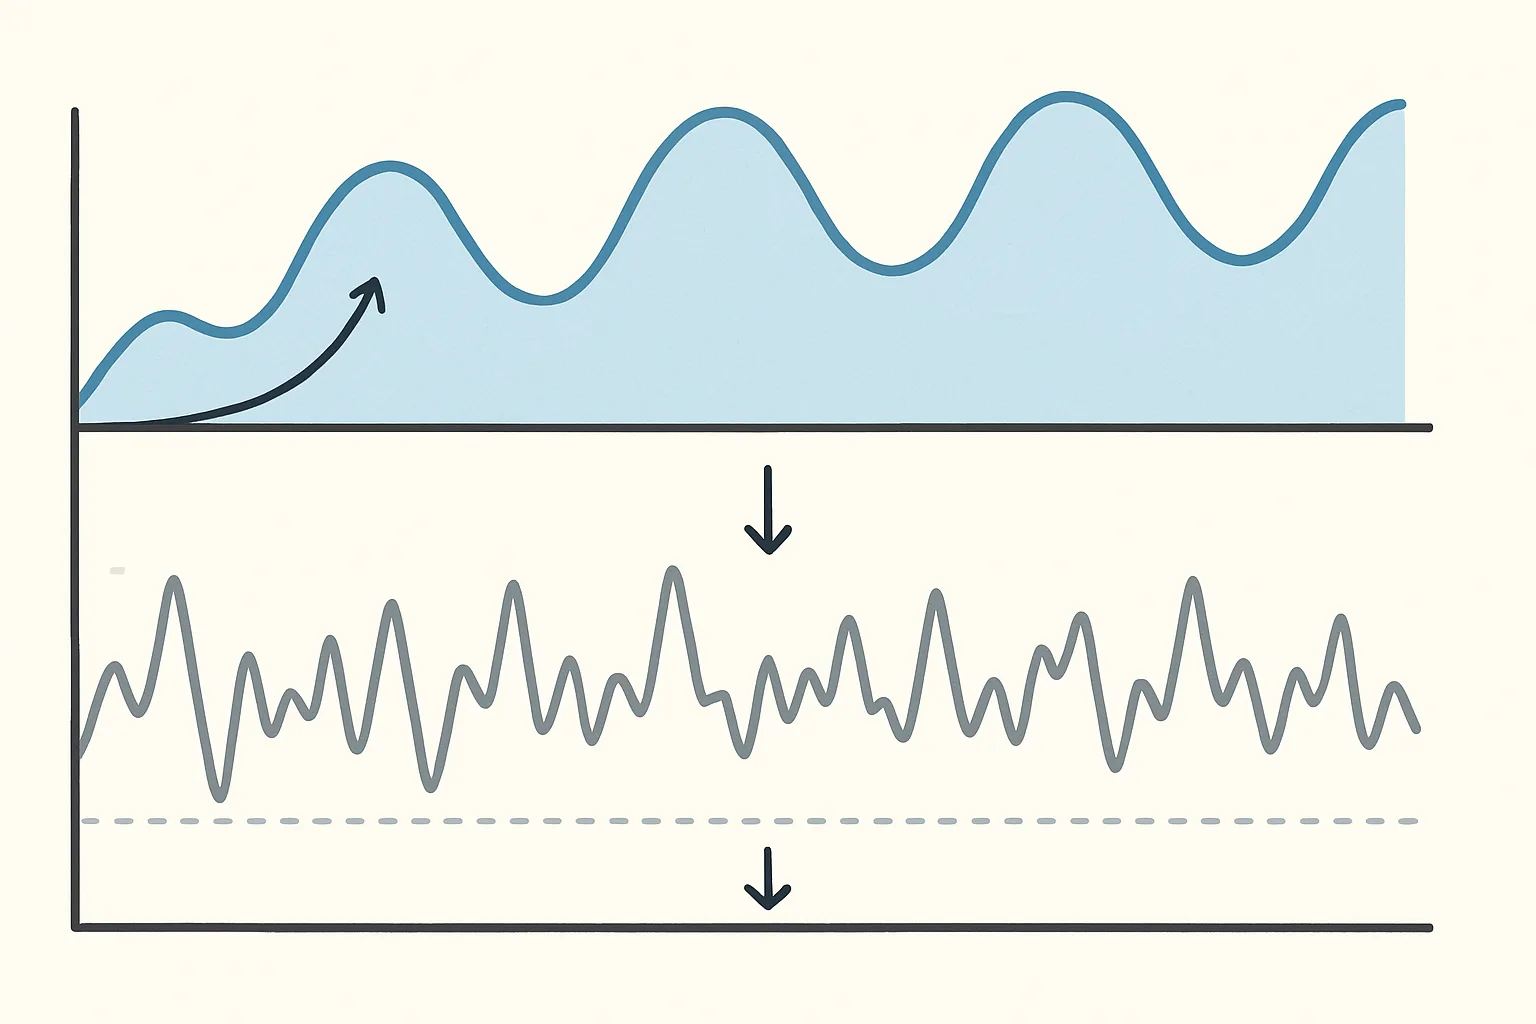
The Seasonality Confusion Problem
Every December, many marketing teams celebrate their best month ever. In January, they panic about declining performance. Both reactions misread the data — December growth is often seasonality, not campaign excellence; January decline is seasonality again, not strategy failure.
Without separating seasonality from underlying trend, you'll celebrate seasonal peaks (attributing them to your work) and panic at seasonal troughs (making unnecessary strategy changes). Our marketing analytics team builds seasonality decomposition into every client's analytics framework.
The Three Components of Any Time Series
Any marketing metric over time contains three components:
- Trend: The underlying long-term direction (growing 3% per month)
- Seasonality: Predictable, repeating patterns (December always up 40%, January always down 25%)
- Noise/Residual: Random variation and one-time events (that week a celebrity mentioned your brand)
Good decisions require understanding which component is driving what you're seeing.
Step 1: Identify Your Seasonality Pattern
Minimum data required: 2 full years of monthly data. If you have less, your seasonality analysis is guesswork.
In GA4: pull monthly sessions (or conversions) for 2+ years. Export to a spreadsheet.
Visual method: Plot the data. Recurring patterns (same shape each year) = seasonality.
Analytical method: Calculate each month's index = (that month's value) / (12-month trailing average centered on that month). Average across years to get stable seasonal indices.
Step 2: Build a Seasonality Calendar
For each month, calculate the seasonal index:
- Index > 1.0: That month is above your annual average (e.g., December = 1.4 = 40% above average)
- Index < 1.0: That month is below average (e.g., February = 0.7 = 30% below average)
This calendar becomes your planning tool. If your annual revenue target is £1.2M (£100K/month average), you don't plan for £100K in December (plan £140K) or February (plan £70K).
Step 3: Deseasonalize to See True Trend
Deseasonalized value = Actual value / Seasonal index
Example: December revenue of £140K with December index of 1.4 → Deseasonalized = £100K
Now compare December £100K to November's deseasonalized value (November actual £90K / November index 0.9 = £100K deseasonalized). The business is flat — even though raw numbers made December look great by comparison to November.
Plotting deseasonalized values reveals your true underlying growth or decline trend, stripped of seasonal distortion.
Step 4: Use Seasonality in YoY Comparisons
Year-over-year comparison is the most common way to control for seasonality — comparing January 2026 to January 2025 removes the January seasonal effect.
However, YoY comparisons fail when the prior year had unusual events (COVID year, viral moment, major campaign). In these cases, use a 2-year CAGR (compound annual growth rate) or compare to the pre-event baseline.
Seasonality Adjustments in Budget Planning
Factor seasonality into ad budget distribution. Spending your budget evenly across months when demand varies 2x between months is inefficient:
- Increase budget in high-demand months (more people searching → lower CPAs)
- Reduce budget in low-demand months (fewer searchers → higher CPAs, lower overall volume)
- The efficiency argument: the same budget generates 40% more conversions if shifted toward peak season
Connect your GA4 data to BigQuery for automated seasonality decomposition using SQL window functions. Our marketing analytics team builds these models into client reporting frameworks. Contact us to build seasonality-adjusted analytics for your business.
Need expert tracking setup?
Our Google Tag Manager experts have delivered 500+ tracking setups with a 98% success rate.
Get a Free Consultation →