The Problem with Siloed Channel Reporting
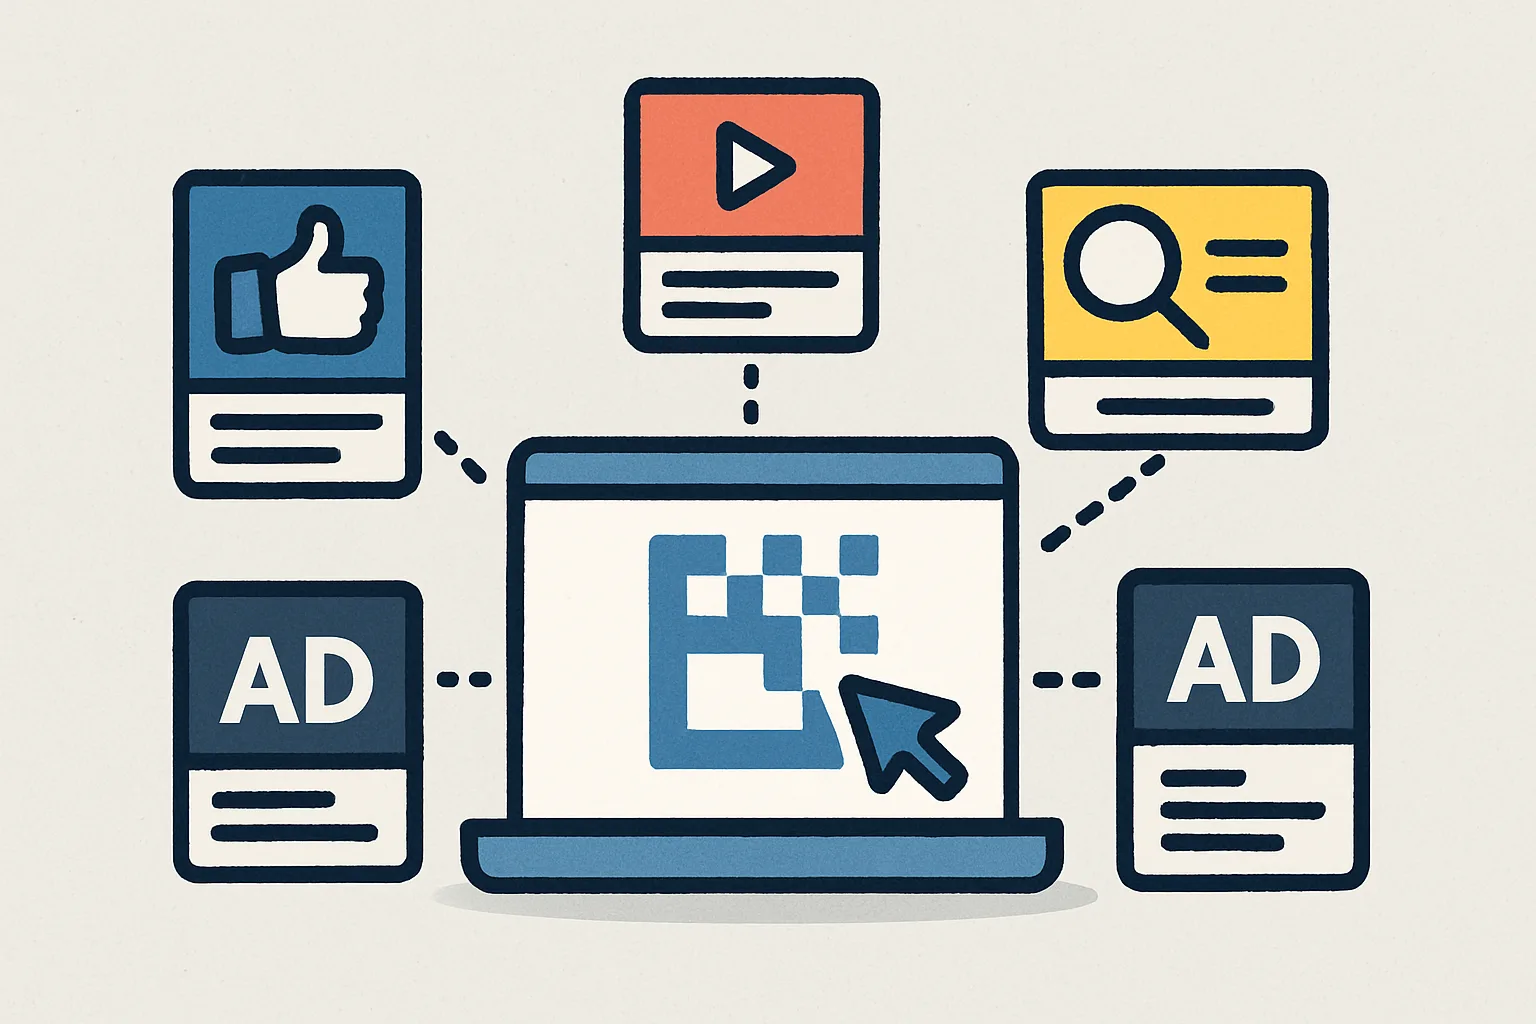
Most marketing teams review Google Ads in the Ads interface, Meta performance in Business Manager, and organic traffic in GA4 — three separate tools with different attribution models, date filters, and metric definitions. A multi-channel dashboard breaks down those silos, showing all channels in one unified view with consistent metrics.
Architecture Options
There are two approaches to multi-channel dashboards in Looker Studio:
- Blended data sources: Connect each channel's data source separately and blend them in Looker Studio. Works for 2-3 channels. Gets complicated with more.
- BigQuery as the hub: Push all channel data into BigQuery, normalize it into a unified schema, then connect Looker Studio to BigQuery. Works for any number of channels. This is the approach we recommend for serious multi-channel reporting.
Data Sources for Multi-Channel Dashboards
- Google Ads: Native connector — cost, impressions, clicks, conversions, conversion value
- Meta Ads: Partner connector (several options in the gallery, some paid)
- Google Analytics 4: Native connector — sessions, users, conversions by channel
- Search Console: Native connector — organic impressions, clicks, position
- LinkedIn Ads: Partner connector
Normalizing Metrics Across Channels
Each platform defines "conversion" differently. Before building the dashboard, decide on consistent definitions: Is a Meta "result" the same as a Google Ads "conversion"? Align metric definitions in writing before building any visualizations, or your channel comparison table will compare incompatible numbers.
Key Multi-Channel Views to Build
- Channel overview: Table with all channels in rows, Spend / Conversions / CPA / ROAS in columns — the executive summary view
- Trend by channel: Multi-line time series showing daily spend by channel — highlights seasonality and budget shifts
- Attribution paths: If your GA4 attribution is set up, show conversion paths by channel combination
For the BigQuery-backed version of this dashboard, contact our team. Our Looker Studio service handles the full pipeline from data ingestion through dashboard delivery.
Need expert tracking setup?
Our Google Tag Manager experts have delivered 500+ tracking setups with a 98% success rate.
Get a Free Consultation →