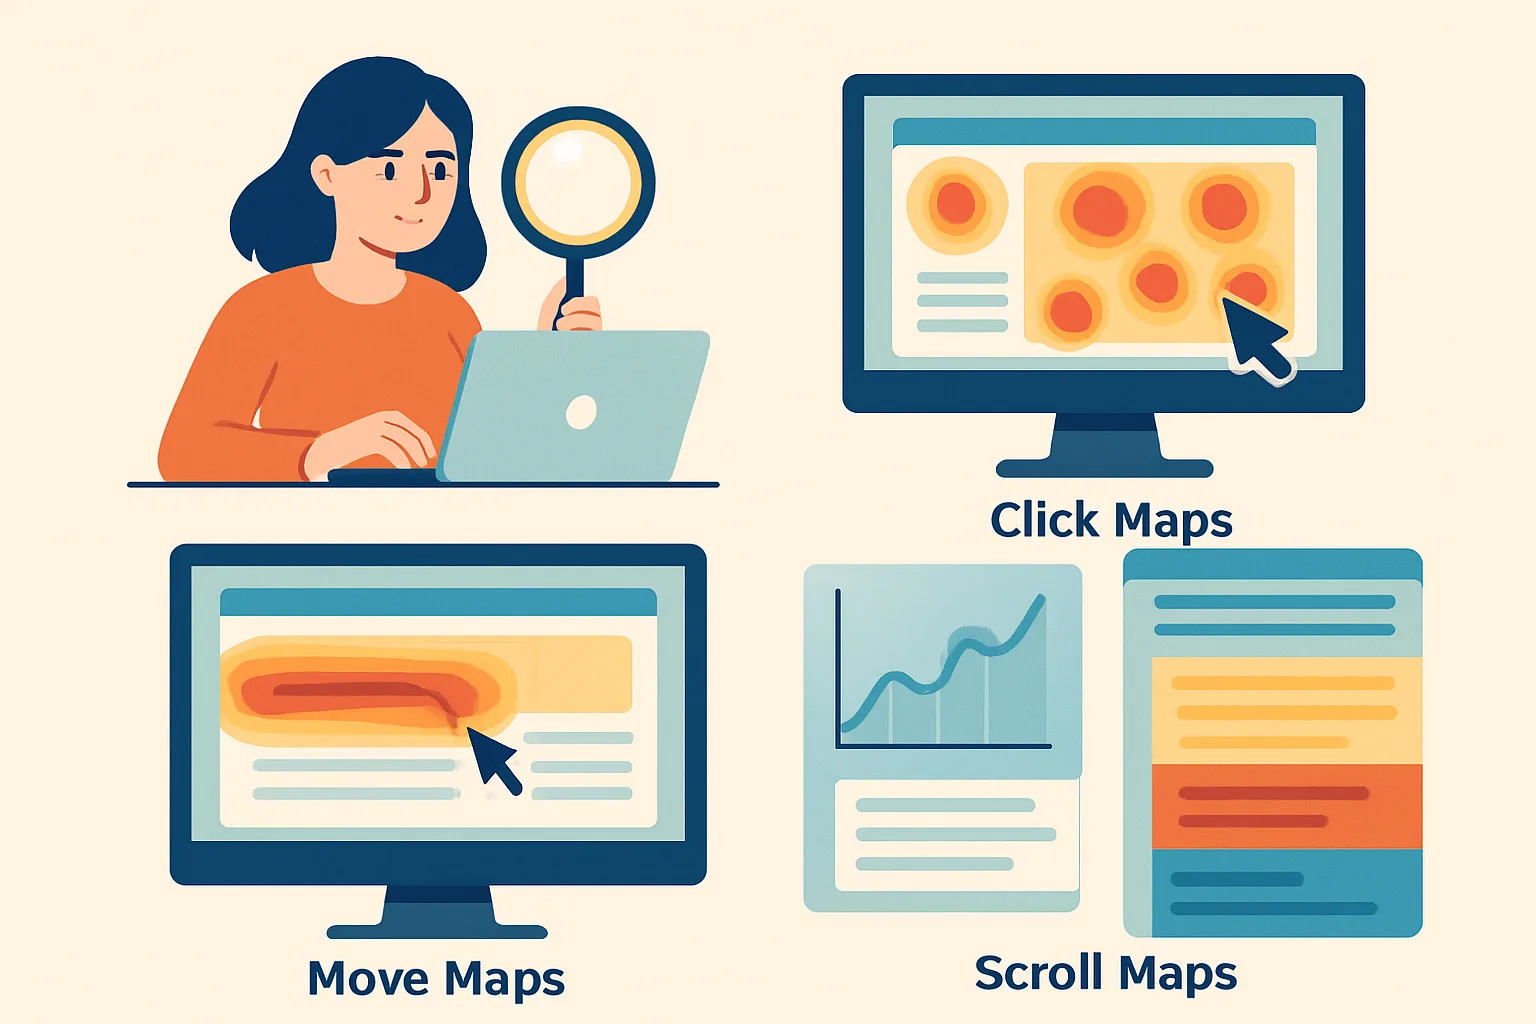
Heatmaps Lie If You Can't Read Them
A heatmap looks immediately intuitive — red = hot (lots of clicks), blue = cold (ignored). But interpreting what that means for your conversion rate requires understanding the context behind the colors. A red spot on your hero image might mean users love it — or they might be clicking it expecting it to be a link (and getting frustrated when nothing happens).
This guide teaches you to read heatmaps analytically, not just visually. Our behavior analytics team uses these interpretation frameworks on every page audit.
Reading Click Maps
Step 1: Identify What's Getting Clicked
Open your click map and identify the top-clicked elements. Then ask for each:
- Is this element interactive (link, button)? Good — users understand its function.
- Is this element non-interactive (image, text, decorative element)? Problem — users expect interactivity that doesn't exist.
Step 2: Evaluate CTA Performance
Find your primary CTA button on the heatmap. Is it in the top 3 clicked elements?
- Yes: Users understand the action. Look at conversion rate to assess effectiveness.
- No: Something is competing with your CTA. Identify what's getting more clicks and why.
Step 3: Look for "Dead" Clicks
Clicks on elements that have no interaction planned reveal user expectations your design doesn't meet. Common examples:
- Logo images that don't link to homepage
- Section headings users try to click (expecting expanded content)
- Product images that don't enlarge or link to product pages
These are immediate UX improvements — either make the element interactive or remove the visual affordance suggesting it should be.
Step 4: Analyze Click Concentration
If clicks are heavily concentrated on one area and sparse elsewhere, you have a content hierarchy problem — users are finding one element and ignoring the rest. Ask: is the content below the click cluster valuable? If yes, the page design isn't surfacing it effectively.
Reading Scroll Maps
The Fold Fallacy
Web designers obsess over "above the fold" but modern users do scroll — just not infinitely. Your scroll map reveals the actual fold: the point where a significant percentage of users stop.
Key percentages to track:
- 100% line: Everything above here is seen by everyone who lands on the page
- 75% line: Where 25% of users have left
- 50% line: Half of all visitors stop here
- 25% line: Only 1 in 4 users reaches this point
What to Do With Scroll Data
- Move your most critical content (primary CTA, pricing, key value propositions) above the 75% scroll line
- If important content sits at the 25% level, consider restructuring the page or adding a second CTA above the fold
- Check if natural scroll stopping points coincide with visual "page breaks" or whitespace that signals the end of the page
Reading Move Maps
Move maps (mouse tracking) approximate where users look on desktop. Patterns to watch for:
- F-pattern reading: Users read across the top, then down the left side, with less engagement toward the right. Content in the right column of a layout often goes unseen.
- Attraction to images: The mouse gravitates toward faces, product images, and video thumbnails. Place nearby text intentionally — users will read it.
- Dead zones: Large areas with no cursor activity indicate content that's being skipped entirely.
Move maps are less reliable than click maps (cursor ≠ gaze) but useful for broad pattern recognition and content layout decisions.
Segmenting Heatmaps for Better Insights
Raw heatmaps mix all users. Filter for higher-signal segments:
- By device: Mobile and desktop scroll patterns differ dramatically — always analyze separately
- By traffic source: Paid traffic vs. organic may have different engagement patterns
- By new vs. returning: First-time visitors need different information than returning ones
Connect heatmap data to GA4 segments for the richest analysis. Our CRO team conducts systematic heatmap audits on key conversion pages. Contact us for a page-level behavior analytics review.
Need expert tracking setup?
Our Google Tag Manager experts have delivered 500+ tracking setups with a 98% success rate.
Get a Free Consultation →