Why Most Marketing KPIs Fail
Most businesses track marketing metrics. Few track marketing KPIs. The difference isn't semantic — it's functional. A metric is anything you can measure. A KPI is a metric whose movement compels a specific decision.
If you look at a metric and think "interesting," it's a metric. If you look at it and think "we need to do something about this," it's a KPI. Most marketing dashboards are full of the former masquerading as the latter.
Our marketing analytics team helps businesses distinguish the two and build measurement frameworks that actually drive decisions.
The Decision-First KPI Framework
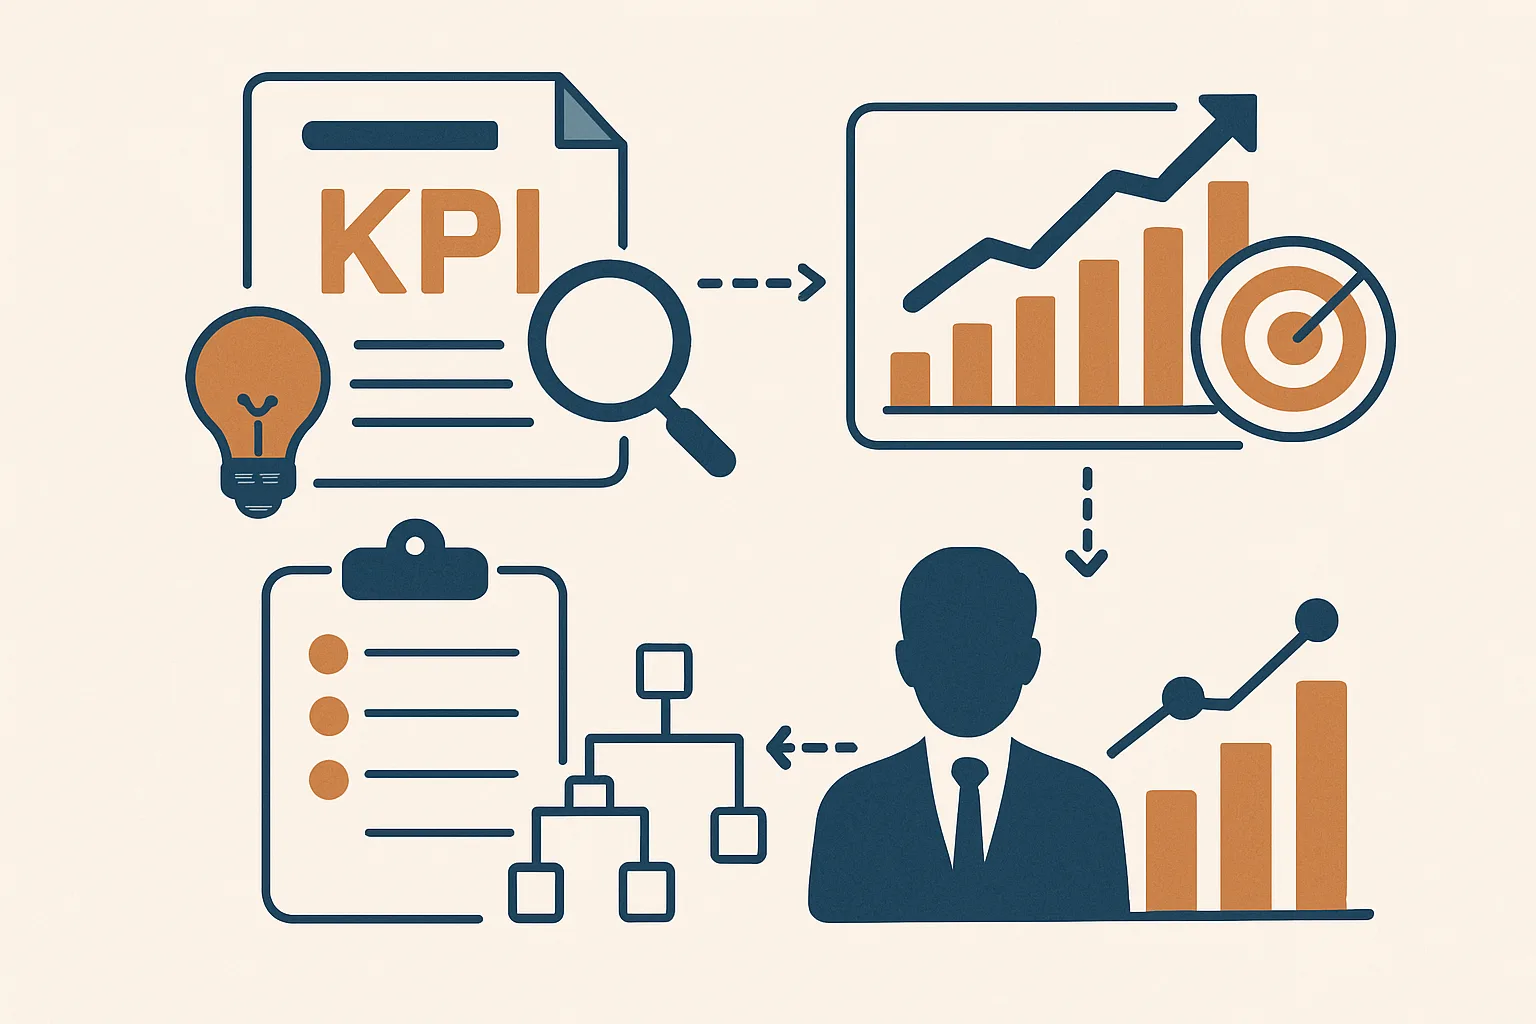
The right way to define a KPI is to start with the decision, not the metric:
- What decisions do we make? (Budget allocation, channel investment, creative direction, targeting changes)
- What information would change those decisions? (If CAC rises above £X, we adjust spend. If ROAS drops below Y, we pause campaigns.)
- What metrics capture that information? These are your KPIs.
Working backward from decisions ensures every KPI has a clear action attached to it. If there's no action a metric can trigger, it isn't a KPI.
The KPI Hierarchy
Marketing KPIs operate at three levels:
Level 1: Business Outcome KPIs
Connect marketing activity to business results. These are the metrics leadership cares about:
- Revenue attributed to marketing channels
- Customer acquisition cost (CAC) by channel
- Marketing-sourced pipeline (B2B) or customer count (B2C)
- LTV:CAC ratio
Level 2: Channel Performance KPIs
Measure efficiency within specific channels:
- Google Ads: ROAS, CPA, impression share
- Email: Revenue per email sent, list growth rate
- SEO: Organic sessions, keyword ranking movement, organic conversion rate
- Social: Cost per lead, engagement rate (when tied to business outcomes)
Level 3: Leading Indicator KPIs
Earlier signals that predict future business outcomes:
- Website sessions trending (predicts future conversions)
- Email open rate trend (predicts revenue per send)
- Ad quality score trend (predicts future CPA)
- Pipeline velocity (B2B — predicts revenue timing)
KPI Definition Template
For each KPI, document:
| Field | Example |
|---|---|
| KPI Name | Customer Acquisition Cost (CAC) |
| Formula | Total marketing + sales spend / New customers acquired |
| Target | < £85 |
| Alert threshold | > £110 for 2 consecutive weeks |
| Decision triggered | Review channel mix, pause lowest-ROAS campaigns |
| Data source | GA4 conversions + accounting system new customer count |
| Review cadence | Weekly |
Common KPI Mistakes
- Too many KPIs: A dashboard with 50 KPIs has none. Limit to 5–8 primary KPIs.
- No targets: A metric without a target is just a number — you can't know if it's good or bad.
- Lagging-only KPIs: Revenue-only reporting tells you what happened; leading indicators tell you what's coming. You need both.
- No action protocol: If the KPI triggers a decision, document what that decision is and who makes it. Otherwise, KPI movement produces meetings, not action.
Our marketing analytics consulting team defines measurement frameworks as part of every analytics engagement. Connect your GA4 and advertising data to a Looker Studio dashboard to monitor your KPIs in real time. Contact us to build a KPI framework for your business.
Need expert tracking setup?
Our Google Tag Manager experts have delivered 500+ tracking setups with a 98% success rate.
Get a Free Consultation →