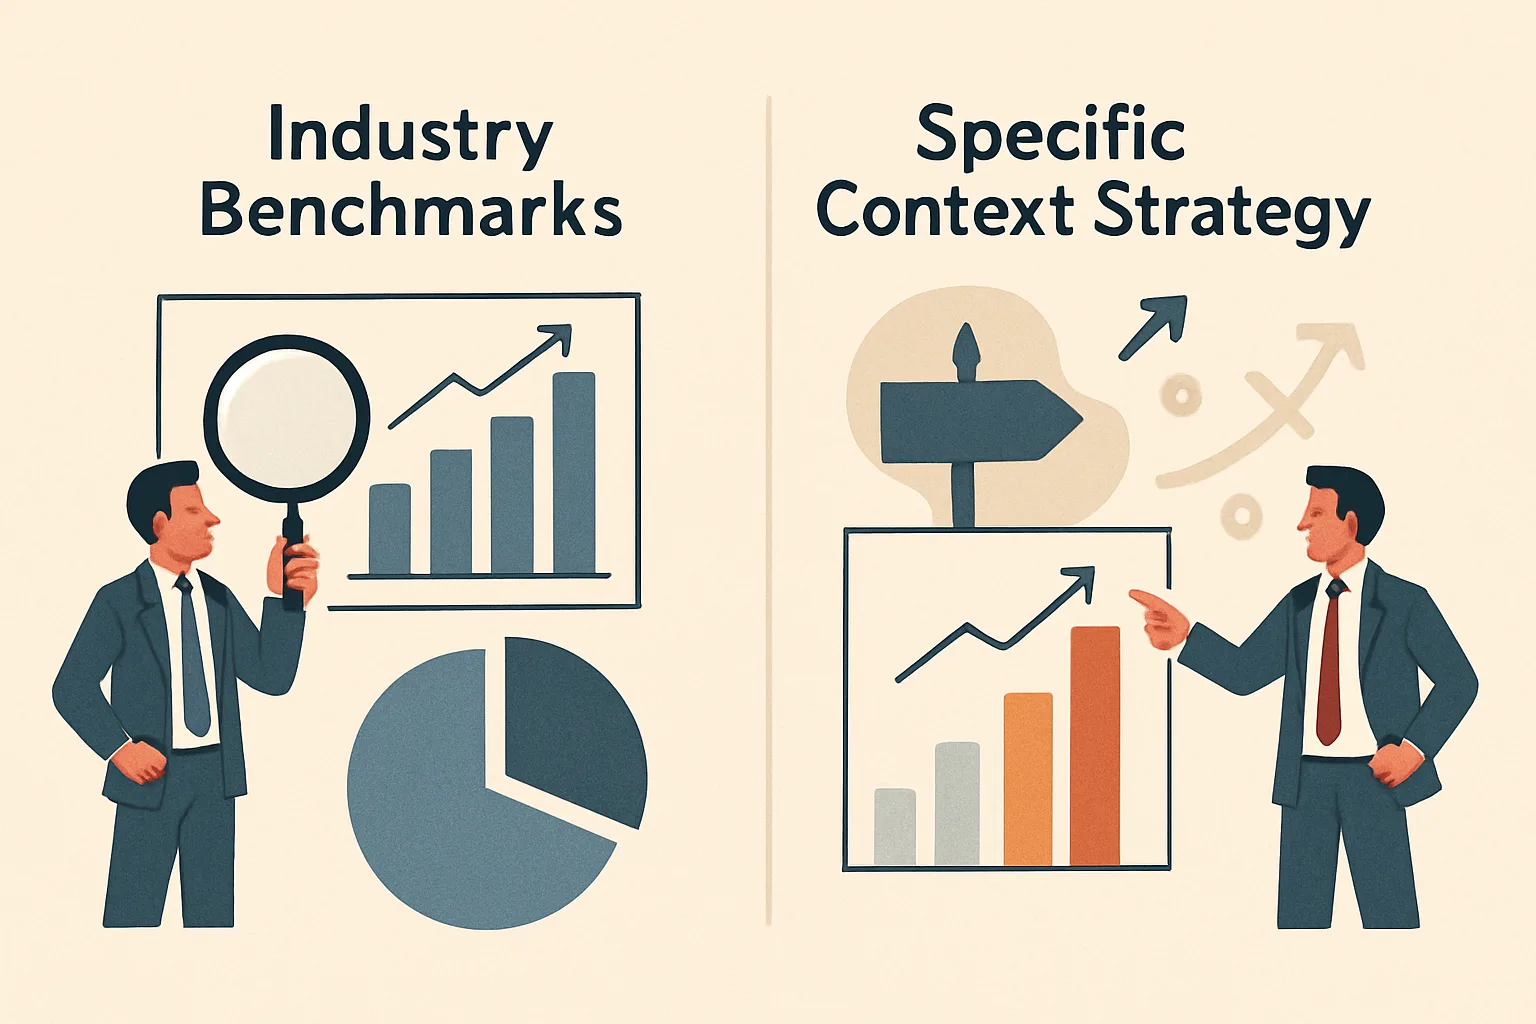
The Benchmark Trap
"Our conversion rate is 2.4%. The industry average is 2.1%. We're doing great." This reasoning is responsible for a significant amount of missed revenue opportunity. Industry benchmarks are seductive — they're external validation, they're authoritative-sounding, and they're almost universally misapplied.
Our marketing analytics team builds measurement frameworks that focus on your own performance trajectory rather than industry averages — while still using benchmarks correctly as context signals.
Why Industry Benchmarks Are Often Misleading
They Average Across Incomparable Businesses
"E-commerce conversion rate: 2.1% industry average" averages together luxury goods sites (0.5%), commodity sellers (4%), impulse-buy products (8%), and subscription boxes (1%). If you sell bespoke jewelry, comparing to an average that includes impulse-buy phone cases tells you nothing useful.
They Don't Account for Traffic Mix
A site that spends heavily on branded search (capturing people already planning to purchase) will show a 6% conversion rate. A site driving primarily top-of-funnel content traffic will show 0.8%. Both might be excellent at their respective traffic quality levels — the aggregate benchmark says one is great and one is terrible.
Benchmark Sources Are Unreliable
Most published benchmarks are from vendor-reported data (email platform reports average open rates for their users, ad platforms report average CTRs). These samples are biased toward customers of that specific tool, often skewed by size and industry, and may not reflect current market conditions.
Anchoring Effect
Once you know "the benchmark," it anchors your targets. If the benchmark is 2% conversion rate and you're at 1.8%, you'll target 2% and stop there. But your specific product, audience, and funnel might be capable of 4% — you'd never know because you stopped asking once you hit the benchmark.
What to Compare Against Instead
Your Own Historical Performance
The most meaningful comparison: are you better than you were 3 months ago? 12 months ago? Your own trend is controllable, contextual, and tells you whether your investments are working.
Your Own Segment Comparisons
Instead of comparing your overall conversion rate to industry average, compare your paid traffic conversion rate to your organic conversion rate. Compare mobile to desktop. Compare new visitors to returning. These internal benchmarks reveal optimization opportunities without external noise.
Your Best-Performing Cohorts
What's the conversion rate of your best campaign, or best landing page, or best traffic source? That's your internal ceiling to target — not some external average.
When to Use External Benchmarks Appropriately
Benchmarks aren't useless — they're just often misused. Appropriate uses:
- Order of magnitude check: If your email open rate is 4%, you have a list quality or deliverability problem regardless of your product category (industry average is 20-40%)
- New channel evaluation: Before launching a channel, understanding typical CPA ranges helps set realistic budget expectations
- Investor reporting: Some investors expect industry benchmarks for context
Use benchmarks to rule out catastrophic underperformance. Use your own historical data to drive optimization decisions. Our marketing analytics team builds measurement frameworks anchored to your own performance. Contact us to build a performance benchmarking approach that actually works.
Need expert tracking setup?
Our Google Tag Manager experts have delivered 500+ tracking setups with a 98% success rate.
Get a Free Consultation →